
With all the tools and libraries available today to display data, it’s hard to make a decision on which one to use. Angular Gridster2 offers a solution that is both simple and versatile in its display options. Today we’ll go through a basic example with the Angular Gridster2 library using the public API from the Art Institute of Chicago to display a static art gallery grid. 🎨
The full documentation for the API can be found here:
Procedure
First, we’ll need to set up the environment. If not installed, go ahead and install the latest stable versions of Node and npm.
- Node: https://nodejs.org/es/
- npm: https://www.npmjs.com/
Next we’ll get our Angular project up and running. Install the Angular CLI tool, which will help us manage our project:
npm install-g @angular/cli |
Create a new project with the ng new command:
ng new my-art-grid |
Install Gridster:
|
The following code will call the API to fetch art images and display them as Gridster tiles:
app.ts
import { HttpClient } from '@angular/common/http';
import { inject } from '@angular/core';
import { Component } from '@angular/core';
import {
  GridsterComponent,
  GridsterItemComponent,
  GridsterConfig,
  GridsterItem,
} from 'angular-gridster2';
@Component({
  selector: 'app-root',
  imports: [GridsterComponent, GridsterItemComponent],
  template: `
  <gridster [options]="options">
    @for (item of dashboard;  track item; let i = $index) {
      <gridster-item [item]="item">
        <img
          [src]="'https://www.artic.edu/iiif/2/' + paintings[i]?.image_id + '/full/843,/0/default.jpg'"
          [alt]="paintings[i]?.title"
          style="width: 100%; height: auto;"
        />
      </gridster-item>
    }
  </gridster>
  `,
  styleUrl: './app.css',
})
export class App {
  options: GridsterConfig;
  dashboard: Array<GridsterItem> = [];
  paintings = [];

  private readonly URL = 'https://api.artic.edu/api/v1/artworks/';
  private readonly _http = inject(HttpClient);

  ngOnInit() {
    this.options = {
      gridType: 'fit',
    };
    this.getPaintings();
  }

  getPaintings(): void {
    this._http.get(this.URL).subscribe((res) => {
      this.paintings = (res as any).data;

      this.dashboard = this.paintings.map((_, index) => ({
        cols: 2,
        rows: 2,
        y: Math.floor(index / 4) * 2,
        x: (index % 4) * 2,
      }));
    });
  }
}
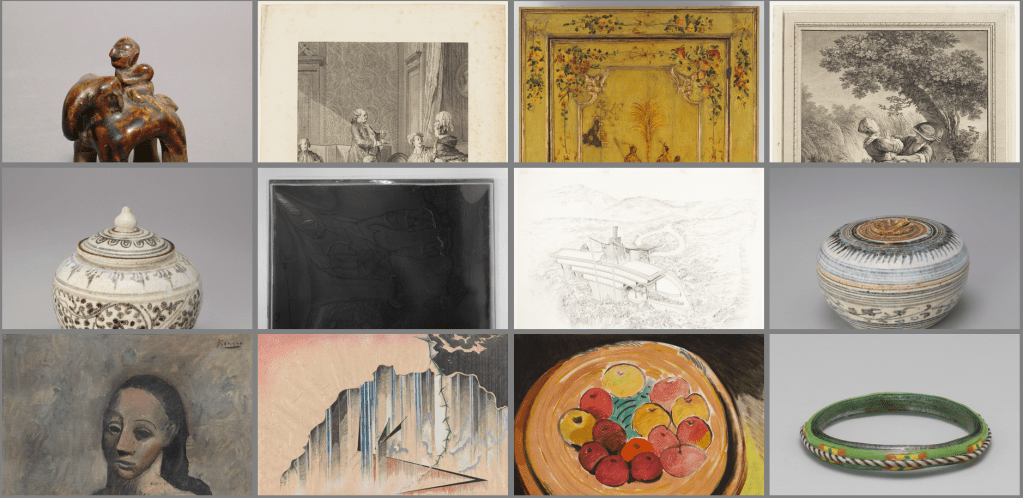
If we check the browser, we should see the following result:
Conclusion
We have just learned how to fetch API data and display it using the Angular Gridster2 library. I hope this tutorial has been both informative and fun. Happy coding!
